Using `xx diagram` to Visualize Your Database Schema
The xx diagram command allows you to easily visualize your database schema. This can be particularly useful for understanding the relationships between tables and ensuring that your database structure aligns with your project requirements.
Step-by-Step Guide
Navigate to Your Xest Project Directory
Ensure you are within the root directory of your Xest project. The
xx diagramcommand only works when executed from this location.Run the
xx diagramCommandIn your terminal, execute the following command:
xx diagramView the Database Diagram
The command will start a local server and open your default web browser to display the database schema. You should see a message like:
Xest Database Diagram is available on http://localhost:7373Your default web browser will open automatically to this URL.
Understanding the Diagram
Once the diagram is displayed in your web browser, you will see a visual representation of your database schema. This includes:
- Tables: Represented as boxes, each containing the table name at the top.
- Columns: Listed within each table box, showing the column names and data types.
- Relationships: Lines connecting the tables to indicate foreign key relationships.
Example
Here’s an example of what the diagram might look like:
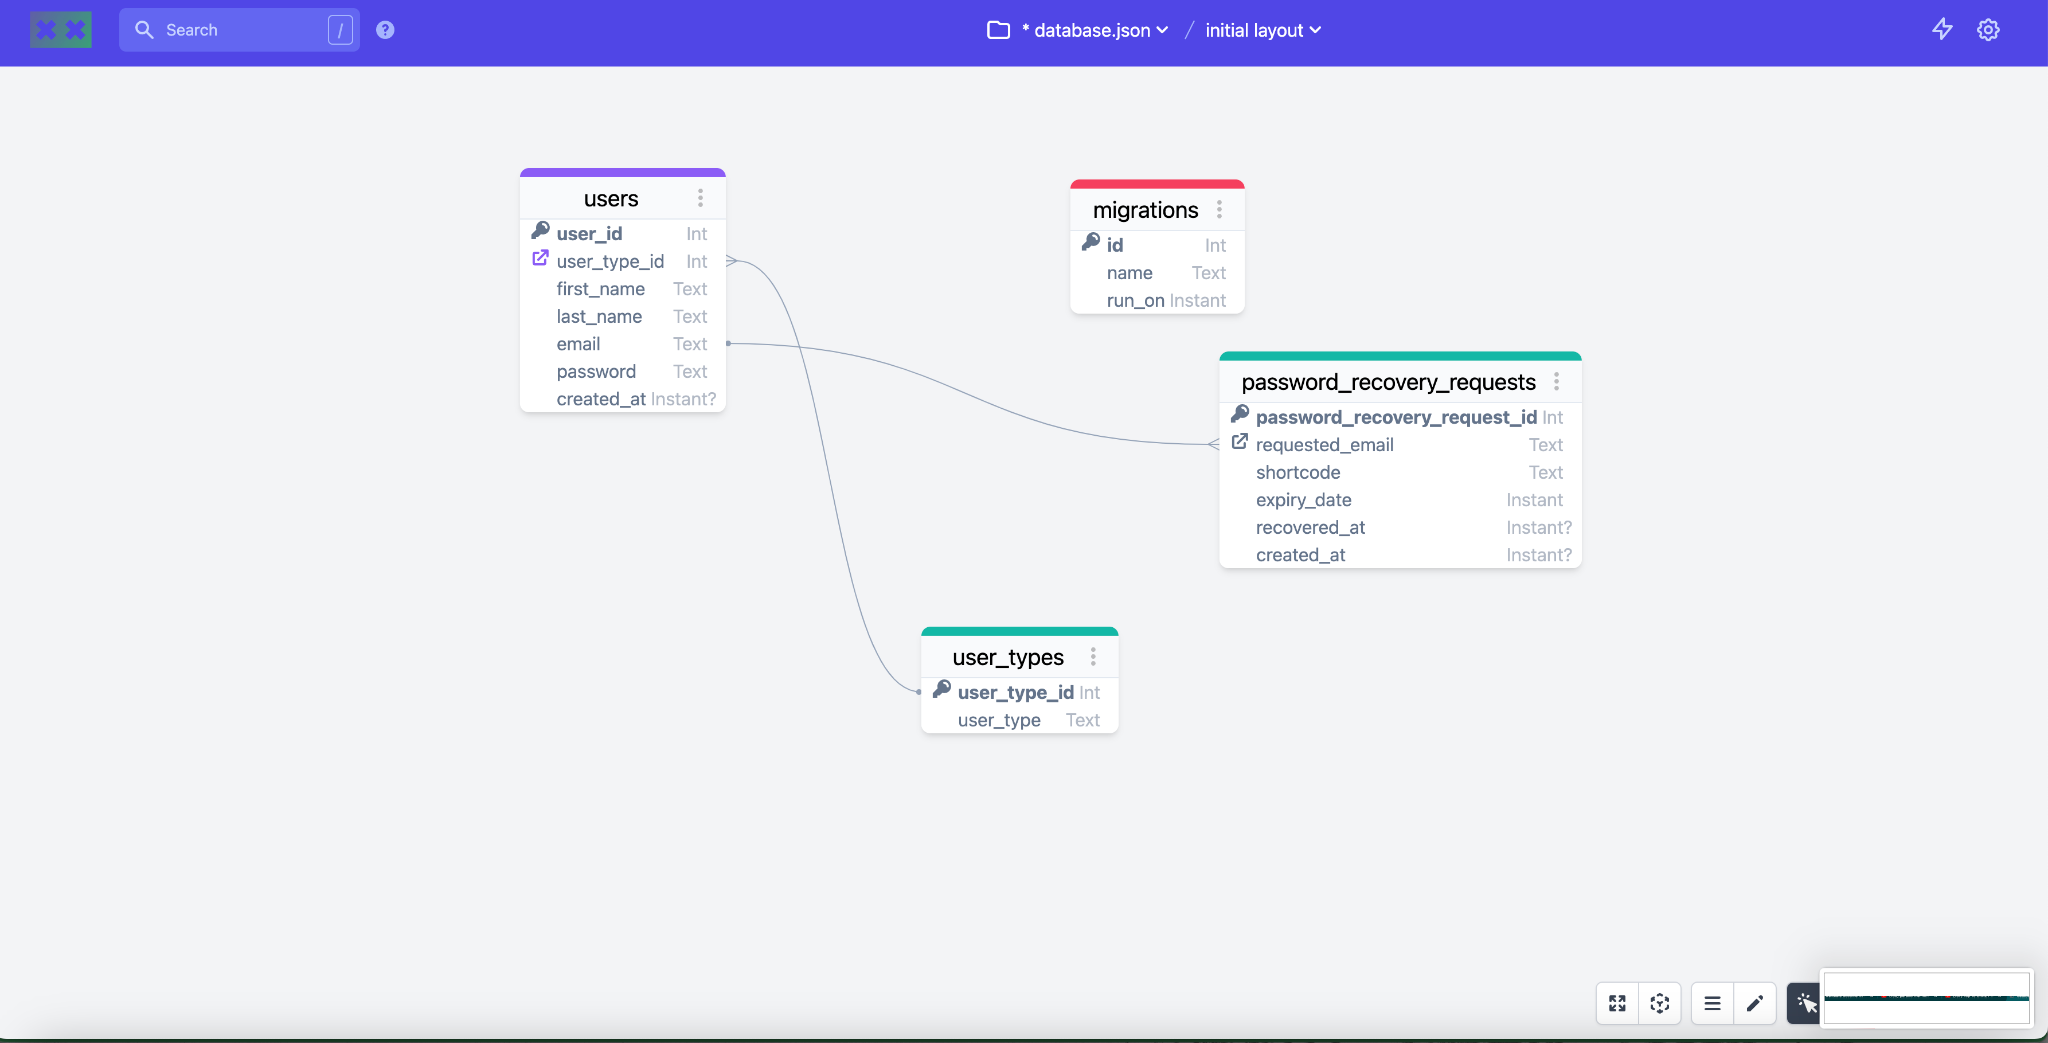
In this example:
- Users Table: Contains columns such as
user_id,user_type_id,first_name,last_name,email,password, andcreated_at. - User Types Table: Contains columns such as
user_type_idanduser_type. - Password Recovery Requests Table: Contains columns such as
password_recovery_request_id,requested_email,shortcode,expiry_date,recovered_at, andcreated_at. - Migrations Table: Contains columns such as
id,name, andrun_on.
A More Complex Example
Here’s a more complex example of what the diagram might look like for a more sophisticated database schema:
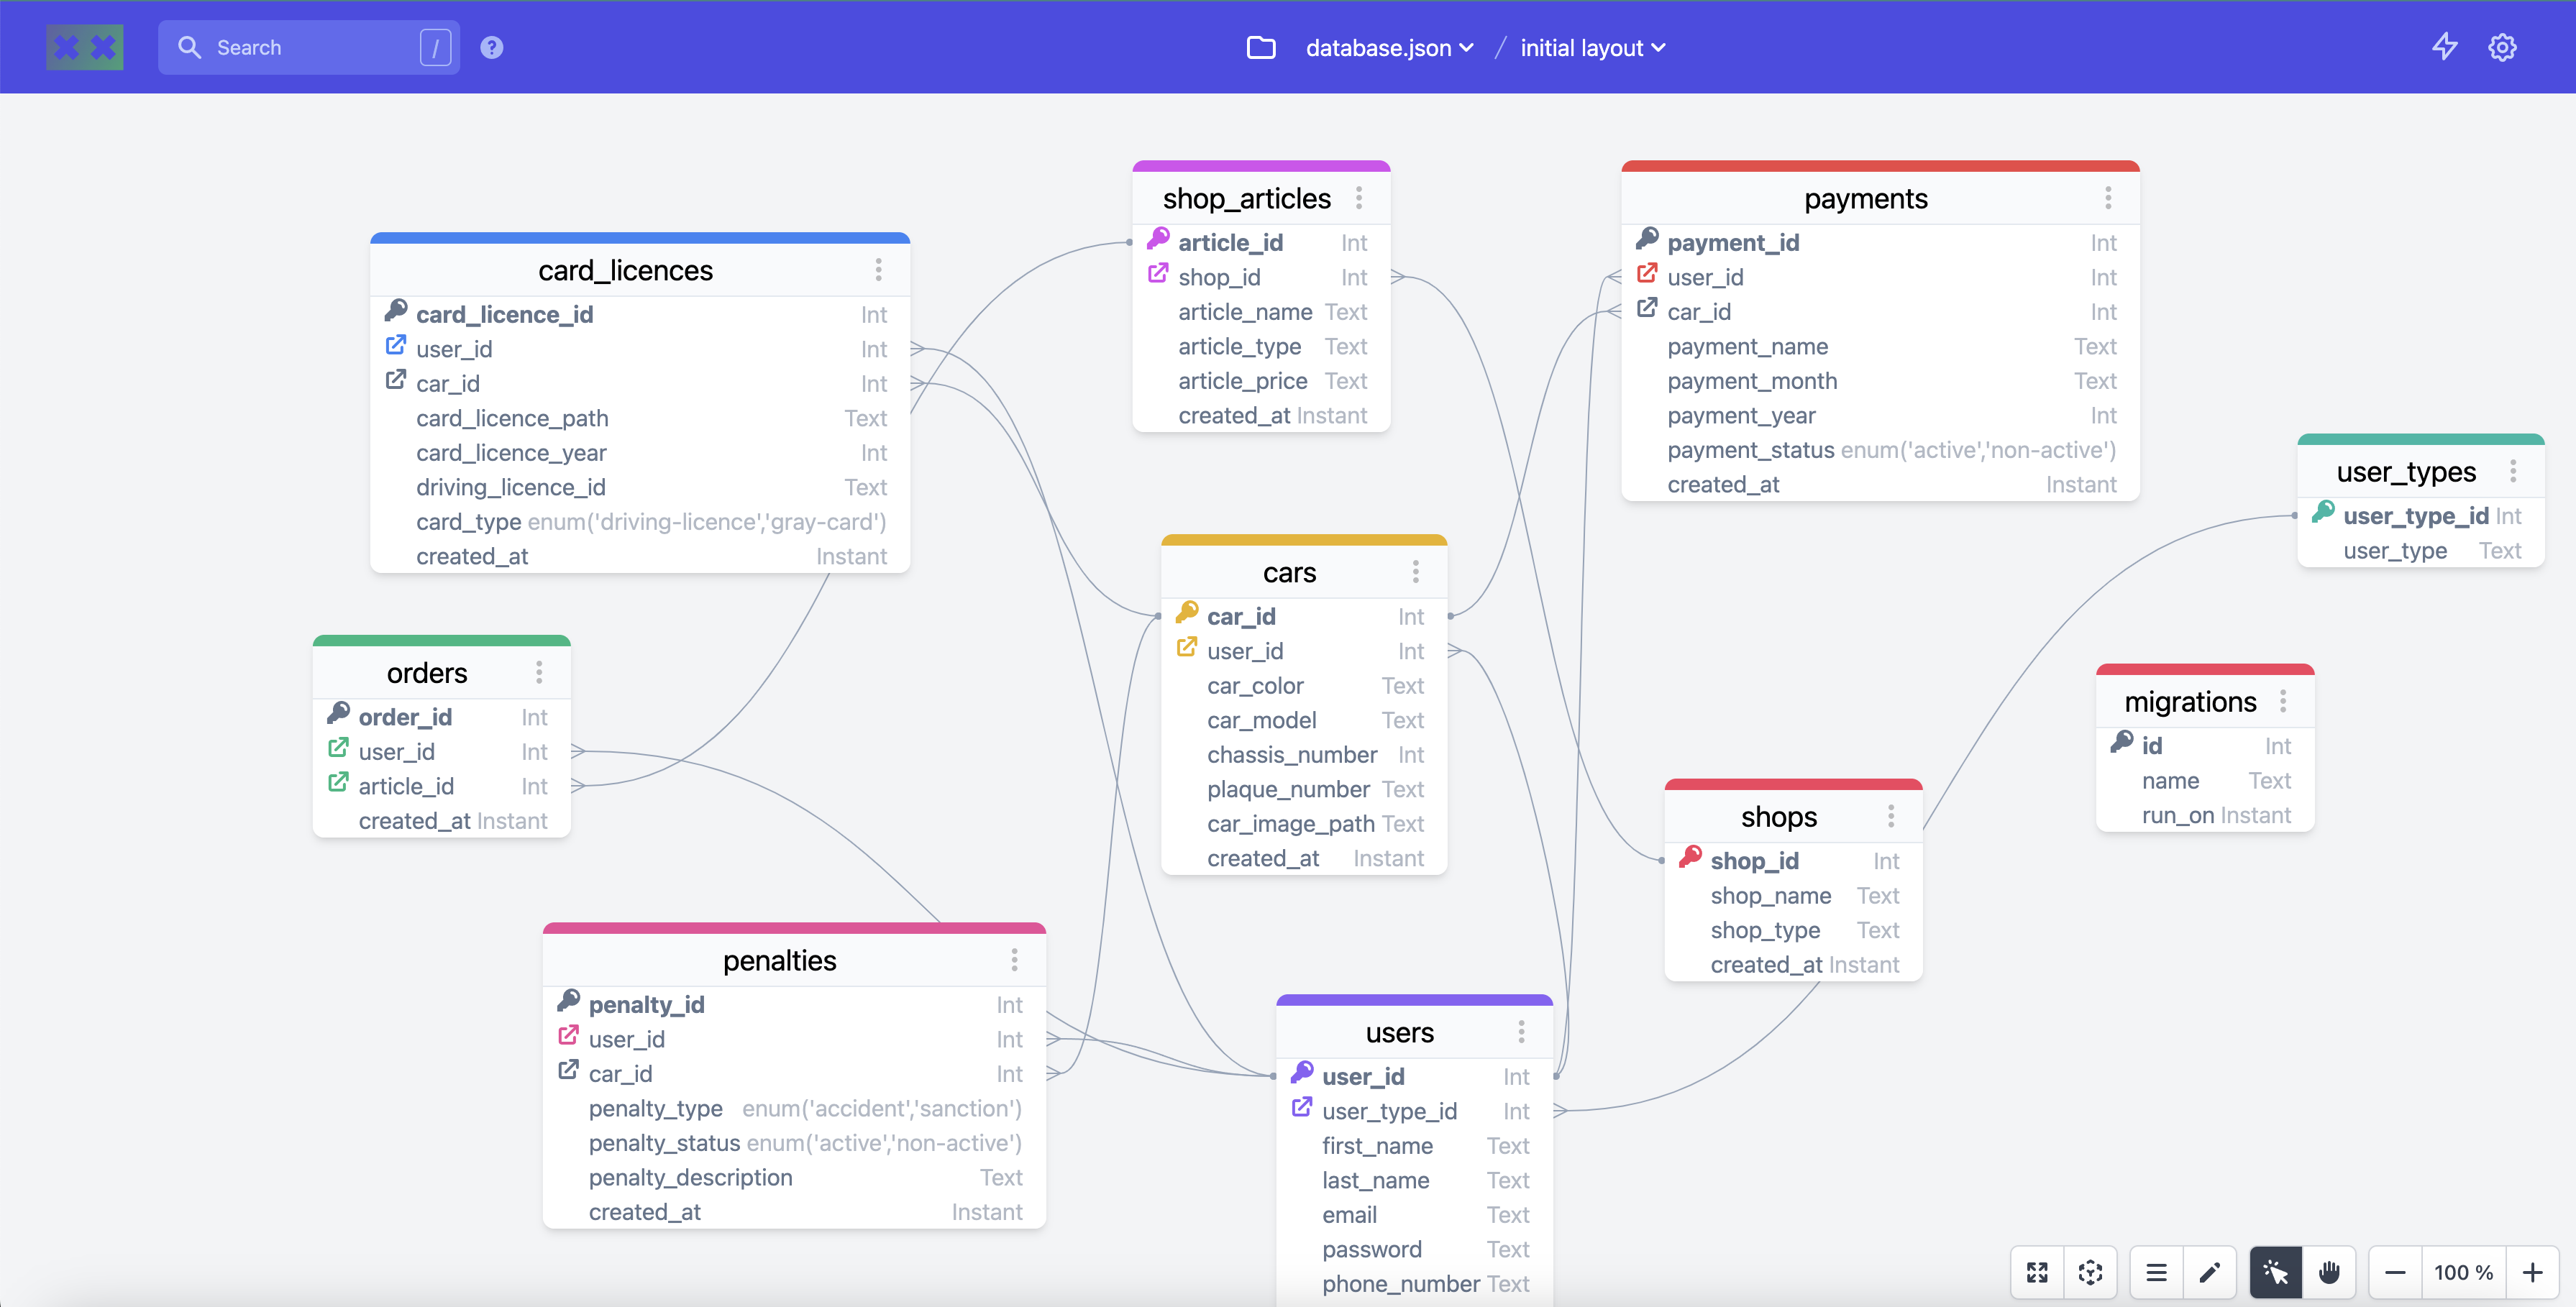
In this complex example:
- Users Table: Contains columns such as
user_id,user_type_id,first_name,last_name,email,password, andcreated_at. - User Types Table: Contains columns such as
user_type_idanduser_type. - Orders Table: Contains columns such as
order_id,user_id,article_id, andcreated_at. - Card Licences Table: Contains columns such as
card_licence_id,user_id,car_id,card_licence_path,card_licence_year,driving_licence_id,card_type, andcreated_at. - Cars Table: Contains columns such as
car_id,user_id,car_color,car_model,chassis_number,plaque_number,car_image_path, andcreated_at. - Penalties Table: Contains columns such as
penalty_id,user_id,car_id,penalty_type,penalty_status,penalty_description, andcreated_at. - Shop Articles Table: Contains columns such as
article_id,shop_id,article_name,article_type,article_price, andcreated_at. - Shops Table: Contains columns such as
shop_id,shop_name,shop_type, andcreated_at. - Payments Table: Contains columns such as
payment_id,user_id,car_id,payment_name,payment_month,payment_year,payment_status, andcreated_at. - Migrations Table: Contains columns such as
id,name, andrun_on.
Additional Information
- Save Changes: If you make changes to the diagram in the web interface, they will be saved back to your project’s
db-diagram.jsonfile.
This tool makes it easy to understand and manage your database structure, providing a clear visual representation that can be quickly shared and discussed with your team.